Saturday, 21 April 2012


I would like to share one chart from Stock Trader’s Almanac which they have put out in their free report.

This chart makes the distinction of a Presidential Year cycle. Because all incumbent Presidents try to pump the market and the current one is no exception.  They all need money from Wall St and TBTF Banks for their campaign.

This chart became available only yesterday. But I have been writing the same thing for past so many days and months.

The only thing that is important to the market; How much money is out there and where that money wants to go.  To all the Uber economorons  out there who are predicting imminent doom of fiat money, sorry guys, I have some bad news for you. You will have to wait.

Did you read the latest efforts of global re-flation? IMF has just increased its war chest by $ 440 billions and most of the money is coming from the developing countries. http://www.reuters.com/article/2012/04/21/us-imf-idUSBRE83I19X20120421

This is specially aimed for Spain and Italy. Why do you think the central banks will stop here? What prevents them to write another cheque to themselves again. Isn’t that they are doing for so many months?

There is a time for everything, even for serious corrections. If you look at the monthly chart of SPX

We are in a range for over 15 years now and are about to complete the upper side of the range before any serious correction can happen.  Let ZH scream and shout about Spain and break up of Euro, nothing much is going to happen till the end of 2012. For now it’s all noise and fear mongering is a very good business model.

However, that does not mean I am suggesting that we should go long now. On the contrary, I think we have a short term opportunity for a fishing expedition when a short and violent correction takes place. I expect that correction, between 5-10% should start by next week, after Apple results. I plan to write a short note on Apple tomorrow. I think end of such correction will be a buying opportunity, not now. For now, we can either sit on cash or try the short side, but do not expect any major correction.

I wish you a very enjoyable weekend. Thank you for reading http://bbfinance.blogspot.ca/ . Please forward it to your friends and invite them to join me in twitter. ( @BBFinanceblog).

Thursday, 19 April 2012


This is a typical topping process we are witnessing.  Most of the indicators have turned south and tomorrow is the last day for cycle top.  It does not mean that we will have huge sell-off from tomorrow. Actually we might see a green day tomorrow being Op-Ex.  As they say, topping is a process.

Gone are the days when the index will go up on the one way street no matter what. But I still do not have any target for downside. Will it be similar to 2011?

Given the fact that it is a Presidential election year when the incumbent grease the market to stay in power and huge liquidity around, I do not think a huge sell off like 2011 is in cards.

I am still waiting on the sideline without being short. One of the simple sell signal occurs when fast moving averages like 20 DMA crosses under slow moving averages, say 50 DMA. Right now they are coming close have no crossover has occurred yet.

Gold seems to be coming to a bottom but I would still wait for sell-off in equities to see how all the risk assets behave together. Here is a long term weekly chart of GLD.

As you can see, the price of gold is just touching the trend line. Even with the correction it has not broken the trend line yet. Gold may well cross $ 2500 in the next 12 months before the bull market in Gold ends.

Hope you all are in cash and cushy.  Thank you for sharing my thoughts and reading http://bbfinance.blogspot.ca/

Wednesday, 18 April 2012


Things are not so good across the pond. ECB is unable to make the PIIGS pretty even with 1 Trillion Euro lipstick. (LTRO).  Spain bailout is not a matter of if but when. Italy has just announced that their target for reaching budget target will be postponed by one more year. Given all that bad news, why is Euro still above parity? Why the commercials are long Euro week after week for last so many months as you can see in the COT report. What do they know that we are missing?

ZH and all the proponents of doom and gloom are predicting the imminent end of the world and urging us to load up on gold, gun and canned food. But Gold is refusing to go up, Campbell shares are down in the dumps and only gun sales are up. What gives?

I think the answer can be found in the following graph.

It shows the liquidity pumped in by all the central banks around the world.  And Obama will do anything to get re-elected. If he can make a side deal with the Russians regarding missile defense, do you think he would feel shy of pumping the market?

One might ask, if so much money is being pumped in the system, why we do not see much of inflation, leave alone hyper inflation? There are two reasons. First, inflation is rampant in BRIC countries. It is officially around 10% in India and 9% in China. Actually it is much more. Secondly, In developed countries like USA, it is hidden from direct public eye. If you are doing your groceries, you definitely feel the pinch and see either prices of milk,bread and other essentials are going up every year or package sizes are reduced by the companies who charge the same price as before. It is just because the way they calculate CPI in USA that they are able to show inflation below 2%.

But most importantly, there is a huge erosion of asset values which is kind of deflationary. So basically what we have in USA is stagflation. How does that affect the stock prices? In the long run, not the way Bernanke wants them. But that is another story.

I have been writing not to short the market yet, although the upward momentum is almost over. Because we might go in sideways for some time before any correction and even then the correction may not be very deep.
That’s it for today. Trade safe and do not front run. Remember we do not always have to be in the market.

Thank you for reading http://bbfinance.blogspot.ca/.

Tuesday, 17 April 2012


I apologies for my long absence. It has been extremely busy at work with extended hours. It never seems to finish. This is more so as we are shifting the entire client portfolio to a defensive position.

Anyway, nothing much has changed since last Thursday. One big up day followed by a big down day followed by a still bigger up day. The trends following models are giving whipsaw after whipsaw. If you remember my last post, I said, it is time to sell in to strength and remain in cash. It is not yet time to short. And I still stand by that comment.

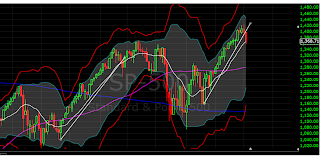
Just a look at the daily chart of SPX should convince you that we are in a topping process.

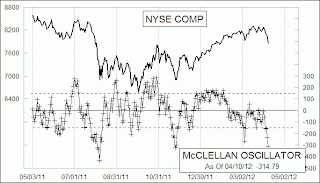
It seems that the DMI is about to have a cross over. I keep writing that we will re-test the high and only when we fail, we can be sure of trend reversal.  McClellan Oscillator is still negative, even after the huge gain today.

It still has some more room to run which might take SPX near the earlier high.

As per my cycle analysis, the top is around April Op-Ex. It is not an exact science and it may move around a day here and there but I would not be in any long position after Friday, April 20th.  It is either SPX 1450 or April 20th, whichever comes 1st. The earning season has been good so far and that it’s keeping the hope alive but hope is not a good trading strategy. So we might see a last minute surge before the curtain falls.

How far we will fall in correction is not yet sure. But most likely, May will not be very kind to the bulls. It is important to remember the time frames. In a longer time frame, we are in an uptrend but in a shorter time frame, we will see corrections. That correction will be a buying opportunity but we need to know when the correction is over when it is time to buy again. As of now, it is time to sit on the sideline.

Thank you for all your kind emails and comments. I will try my best to be regular.

Thursday, 12 April 2012


Today was an example as why not to front run. It also validates my reason not to short the market even when the trend model gave sell signal and stayed neutral. I had many factors to consider like few technical parameters, trend model, cycle analysis and money flow. And they did not line up together. In the end, I decided to believe the cycles which tops next week.

The earning season has started. Alcoa started with a better than expected result and today Google came out with a better result as well and is up after market. I think the euphoria will be back tomorrow and next week and all talks of gloom and doom will be forgotten. That is how they set up the market.  Again, it is not the time to go long nor it is the right moment to short. Only good thing to do is to sell in the strength. We might see SPX reach 1450 next week if the euphoria continues but risks are high. And I am writing this over and over, unless we see a re-test of the high and its failure, we are not sure of trend reversal.

When the market sold off 5%, I got some hate mails, ridiculing my call of SPX 1450 and market top call by April Op-Ex. My favourite  south Asian (I think he is an Indian settled in US) troll even told me to stop writing. I fail to understand why the troll reads my blog and spend so much emotional energy to hate someone whom he has never met. Internet gives us anonymity and the chance to show our true character. May be the guy grew up in a hateful environment and had a difficult childhood. May be he saw his father abusing his mother. Who knows. But that guy is truly damaged.  The bottom line is, chances are we will still see a new high before the market rolls over. I still do not rule that out.

Today AUD gave a new buy signal and US $ broke through important Fibonacci support level. Michael Boutros has this nice chart: (Ticker: USDOLLAR)

Even the RSI broke through the rising trend line.

The Speculative Sentiment Index shows that the retail trade is long USD and short EURO and AUD.

SSI is a contrarian indicator and it signals more gains for Euro and AUD, at least in the short term. If that were to happen it will definitely benefit the risk assets including equity.

Tonight we will have Chinese GDP data release and I am sure it will add to some volatility tomorrow.

Gold is at a very interesting cross road. It is near the end of the cycle bottom, but we have not seen any capitulation of the investor sentiment yet. Today the Gold is up because US$ was down big time. But by end of April or early May, we are likely to see further strength of US Dollar. How PM sector behaves during the period of Dollar strength is to be seen. All in all, I am still waiting to see a good bottom for Gold and would rather give up some initial gains.

After a long 3 month up-trending market, we are coming to a period when we will see sideways and choppy movement in the market. I would not like to participate in such markets and will wait for clear and definite trend, whether up or down.  We do not always have to be active in the market.

Thank you for reading http://bbfinance.blogspot.ca/. As usual, I always look for your comments and mails. 

Wednesday, 11 April 2012


From 1422 we came down to 1358 in 5 days. That is about 5% correction which I was hoping for end of March. But even with this small correction we are in oversold territory. How can we hope for a good shake down when we have tripped just out of the gate? That is the reason I am not going short yet. I would like to see a complete trend change lined up with all other parameters, which we do not have. And I am not getting a price target for correction either.

The longer term cycle tops next week which is also Op-Ex week. The week of Op-Ex is generally a bullish week. As per Stock Trader’s Almanac,  on the 1st trading day of the expiration week, DOW is up 15 of the last 22 and on income tax deadline day, DOW has been down only 5 times since 1981. Past is of course no guarantee of the future, but given the fact that we are in oversold region, and indexes generally try to re-test their earlier top before rolling over, it seems likely that the markets will give another try.

By no means am I suggesting going long or shorting. I would rather be on the sideline now, if you had some nice profit so far. Because cash is also a position. May be we can take a short position in the 4th week of April but let us 1st see through the next 4/ 5 trading days and let us see how it goes. One definite indicator of market weakness would be if the indexes fail to make new high. Let’s look at SPX weekly chart.

Almost similar like last year around same time.

Because of the other work commitments, I will have to change my trading style. Going forward, I would be looking to trade as little as possible. Just identify bigger trends and go with that. Other times stay out of the market.

I think for the year 2012, bears will be disappointed. This will be the year when indexes will reach the previous highs and most likely exceed it before going downhill in 2013, 2014. When that move starts and from where it starts, is something I will be watching and waiting for.

SPX monthly Chart.

Thank you for reading http://bbfinance.blogspot.ca/

Tuesday, 10 April 2012

Today we had confirmation of the trend reversal in the trend following model. But McClellan Oscillator is severely oversold.
 So I am not sure if I should go short now.
 From the TA point of view, it is quite possible that we will have a bounce and re-test of the previous high and only when such a re-test fails, we can be sure of longer term bear market.
I would like to draw attention to the last Friday's report where I had shown cases of re-test of earlier high.
Otherwise it will be a flash in the pan. Once we are confirmed of a bear market, we can expect it to continue for a while and not suffer whipsaws.
I would be busy with additional work in the office and that may lead to delays in writing the blog.
Thank you for sharing my thoughts.
Powered by Blogger.

ads by google 2

Popular Posts